


You are asking yourself how to implement the monitoring of your application in a freshly deployed Karbon Kubernetes cluster and present this through one single unified interface using Grafana?
Great question, we will answer it on this page!
When you deploy a new Kubernetes Cluster with Karbon, Prometheus Operator is installed by default and a Prometheus instance is also deployed and configured to monitor your Kubernetes cluster resources. But you can't use this instance to monitor your application, you will need to deploy a new one!
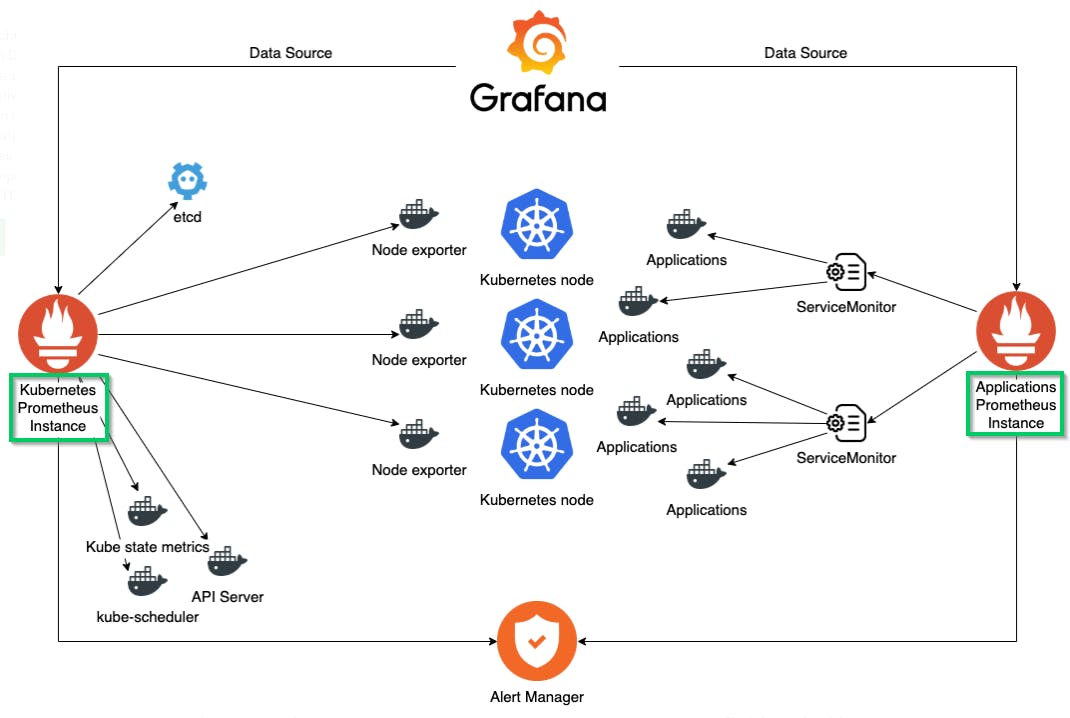
So, first a quick view of the setup that we want to accomplish. On the left side of the diagram below, you can see the Kubernetes Prometheus Instance that is already deployed by default on Karbon and dedicated to the monitoring of the Kubernetes cluster. On the right part, you see the Application Prometheus Instance that we will deploy to monitor the application metrics.
What we will do through this page:
Reconfigure the existing Prometheus resource
Create the new Prometheus resource dedicated to App Monitoring
Deploy and configure Grafana
Deploy an App and validate the setup If you are not using ArgoCD for your continuous deployment or GitOps strategy, you can go down the page until the manual setup.
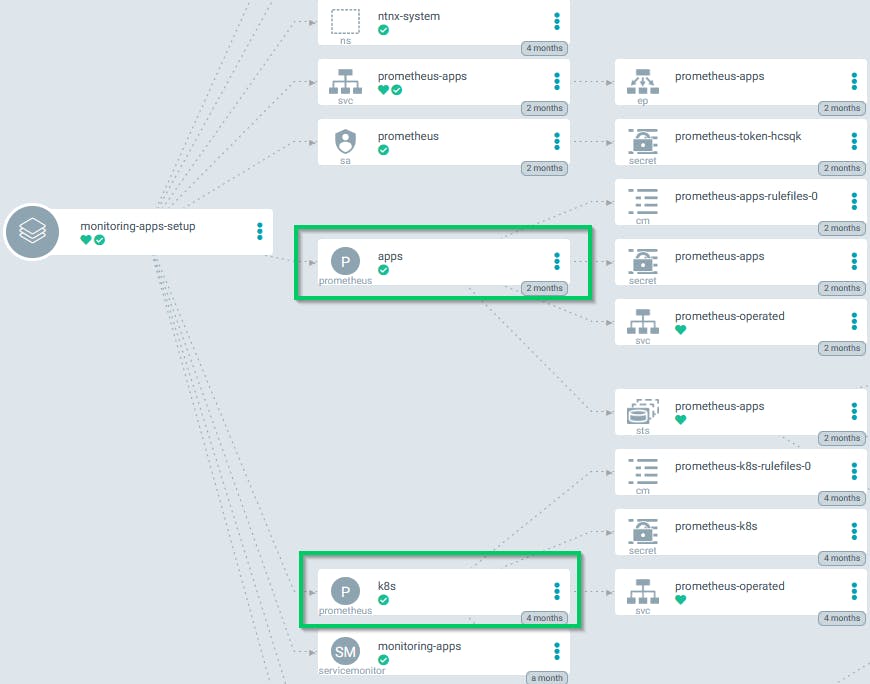
Using ArgoCD it will be easy to set all this up. You can just create a new application in ArgoCD, set the target namespace as monitoring-apps and use this public repository karbon-app-monitoring-demo
After the application is Sync you will see the two Prometheus instances like on the picture below.
If you are not using ArgoCD or any continuous deployment tool then we will do the setup manually.
*Have a look at this link if you have interest to use an CD tool ArgoCD on Kubernetes *
Ok, so let's go by hand
Reconfigure the existing Prometheus resource and create the new Prometheus dedicated to App Monitoring
The first step is to reconfigure the Kubernetes Prometheus Instance so that it only looks at resources with the label monitoring: k8s. To do this we modify the serviceMonitorNamespaceSelector of the Prometheus resource to look for the new label and we set this label on the Kubernetes namespaces so they will still be monitored by this Prometheus instance
Source File : karbon-app-mon-setup-demo.sh
# Set label on the system namespace kubectl label ns/kube-system monitoring=k8s kubectl label ns/ntnx-system monitoring=k8s
# Patch existing prometheus resource to limit ServiceMonitors used kubectl -n ntnx-system patch --type merge prometheus/k8s -p '{"spec":{"serviceMonitorNamespaceSelector":{"matchLabels":{"monitoring": "k8s"}}}}'
Then we can deploy the new Application Prometheus Instance , his ServiceMonitor and required RBAC with the commands below. This will create the monitoring-apps namespace and deploy all the Prometheus setup inside it. It will also create the ServiceMonitor resource with a selector on the label monitoring: apps. So you will need to add this label to all the services that you want to monitor with this Prometheus Application Instance.
kubectl apply -f https://raw.githubusercontent.com/cisel-dev/karbon-app-monitoring-demo/main/karbon-app-mon-rbac-demo.yml kubectl apply -f https://raw.githubusercontent.com/cisel-dev/karbon-app-monitoring-demo/main/karbon-app-mon-prometheus-demo.yml kubectl apply -f https://raw.githubusercontent.com/cisel-dev/karbon-app-monitoring-demo/main/karbon-app-mon-service-monitor-demo.yml `**Deploy and configure Grafana** The Prometheus setup is now done, we can proceed with the Grafana deployment and configuration. We will deploy Grafana using the official Helm chart. Please review and adapt to your needs the [values.yaml](https://raw.githubusercontent.com/cisel-dev/karbon-app-monitoring-demo/main/karbon-app-mon-grafana-values-demo.yaml) file before to run`helm install`. In our Kubernetes cluster, we run a [MetalLB load balancer](https://devops.cisel.ch/deploy-metallb-as-an-on-prem-load-balancer-for-your-kubernetes-services) service that allows us to specify` service.type: LoadBalancer\`\`\` for Grafana. You may want to set this value as ClusterIP or NodePort.

Source File : [karbon-app-mon-grafana-demo.sh](https://raw.githubusercontent.com/cisel-dev/karbon-app-monitoring-demo/main/karbon-app-mon-grafana-demo.sh)

```plaintext
# Grafana installation
# Prerequisite helm v3 with stable repo  helm repo add stable https://kubernetes-charts.storage.googleapis.com helm repo update
# Create dedicated namespace kubectl create ns grafana
# Install Grafana helm chart
# Please review the values file before applying helm install grafana stable/grafana --namespace grafana -f https://raw.githubusercontent.com/cisel-dev/karbon-app-monitoring-demo/main/karbon-app-mon-grafana-values-demo.yaml kubectl -n grafana rollout status deploy/grafana export SERVICE_IP=$(kubectl get svc --namespace grafana grafana -o jsonpath='{.status.loadBalancer.ingress[0].ip}') export GF_PASSWORD=$(kubectl get secret --namespace grafana grafana -o jsonpath="{.data.admin-password}" | base64 --decode ; echo) echo "you can connect on Grafana http://$SERVICE_IP with admin/$GF_PASSWORD"
Connect to Grafana using the previous information and check if you can see both Prometheus instances in the Data Sources 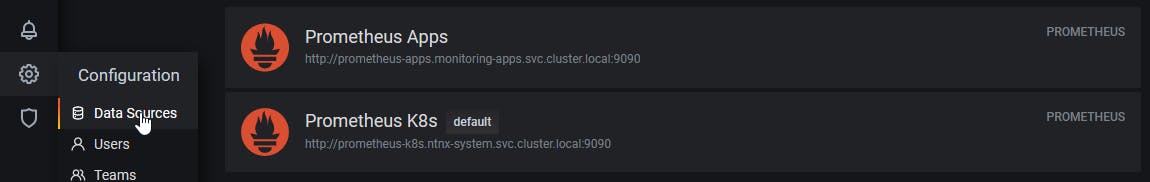
Deploy a demo App
The one below is serving metrics at the /metrics REST endpoint. Once deployed, the app will be shipping random RPC latencies data to /metrics endpoint. We set the label monitoring: apps so the metrics will be available in Grafana through the Application Prometheus Instance.
Source File : rpc-app-demo.yaml
## cat <<EOF | kubectl apply -f - apiVersion: apps/v1 kind: Deployment metadata: name: rpc-app-deployment namespace: default labels: app: rpc-app spec: replicas: 2 selector: matchLabels: app: rpc-app template: metadata: labels: app: rpc-app spec: containers: - name: rpc-app-cont image: supergiantkir/prometheus-test-app ports: - name: http-metrics containerPort: 8081
kind: Service apiVersion: v1 metadata: name: rpc-app labels: app: rpc-app monitoring: apps spec: selector: app: rpc-app ports:
* name: http-metrics port: 8081 EOF
```plaintext
The specific specifics **rpc metrics** exposed by the **rpc-app-deployment** are now available in Grafana.

Start playing around with panel creation using different types of queries!!
You can see below a custom Dashboard that display the metrics of our ArgoCD application running on a Karbon Kubernetes cluster

Enjoy!!
Feel free to comment on this article if you have some question.
www.cisel.ch
References:
- https://medium.com/@christophe_99995/applications-metrics-monitoring-on-nutanix-karbon-c1d1158ebcfc
- https://devops.cisel.ch/deploy-argocd-and-a-first-app-on-kubernetes
- https://github.com/cisel-dev/karbon-app-monitoring-demo